Farmland and Inflation
Investigating the links.
Investigating the links.
Inflation has been particularly high in 2022.
Consider the table below from the European Commission.

Lithuania was the country where yearly inflation was the highest, at 15%.
Yearly inflation is a statistical measure that compares the price of a basket of goods a year apart.
In this case, 15% of yearly inflation in March means that prices are on average 15% higher in 2022 than they were in March 2021.
The following countries followed:
Estonia: 14.8%
Latvia: 11.2%
Spain: 9.8%
Slovakia: 9.5%
Belgium: 9.3%
Greece: 8%
Germany: 7.6%
These numbers are unusually high given the fact that the European Central Bank’s inflation target is 2% per year.
Why has inflation been so high?
Where Does Inflation Come From
Inflation happens when demand for goods or services is higher than the supply of these goods and services.
Likewise, deflation happens when the demand for goods and services is lower than the supply of these goods and services.
Now, the reasons that cause a supply/demand imbalance are what really matter.
Find them below.
Supply Chain Disruptions
The Covid-19 pandemic provoked a disorganization of the worldwide supply chain which is unlikely to run properly before at least 2023.
The shortage (low supply) of containers (high demand) led to higher transportation prices, which led to higher prices of goods, mainly coming from China.
Energy Demand
In April 2020, the price of oil went negative and settled at -$37.63 a barrel.
The lockdown had decreased economic activity and oil demand had fallen. But oil production cannot be turned on and off like tap water.
There was a lot of oil and nobody to buy it, so the price went negative — sellers were effectively paying buyers so they take their oil.
When the economy reopened after the squeeze, there was a boom. The demand for energy was above average as economies tried to catch up on the economic output that had not been produced.
However, the OPEC (Organization of Petroleum Exporting Countries) signaled that it was not willing to increase production faster than planned.
The war in Ukraine subsequently pressured prices even more.
Since it takes energy for almost any type of economic output to be produced, prices rose.
Money Printing
When countries went into lockdown, a lot of workers lost their job and income.
Governments printed money to support the demand for social benefits.
When there is an inflow of money in the economy, there often is an increase in economic activity — people spend the money they earn or receive.
As a result, demand for goods and services increases, and so do prices.
The European Central Bank has printed €1 850 billion since the beginning of the pandemic, to support the economy.
The graph below shows the supply of money in the economy.

While it has been rising since 2013, the pace of printing increased shortly after 2020, as shown.
Farmland and Inflation
Farmland derives parts of its value from the worth of what it produces — namely, food.
Since food is one of the first “goods” to increase with inflation, so does the price of farmland.
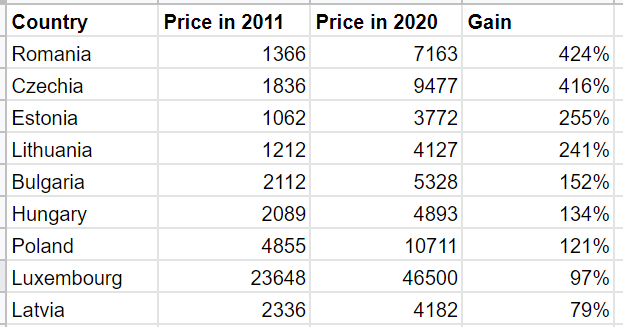
These past few years, the price of farmland has even outpaced the rate of inflation.
Consider the table below.

In these last ten years, inflation evolved as follows.

The evolution of farmland prices has therefore largely beaten up inflation.
Conclusion
Farmland is an interesting asset that can help investors hedge against inflation.
Since the value of farmland is partly derived from the price of food, and since the price of food tends to be correlated to inflation, farmland is one of the best inflation hedges out there.
With LandEx, it’s easy to get started and invest in farmland.
Go to landex.ai today, and begin your land investment journey.
This article should not be considered investment advice.


